 Value Maps provide a useful framework that helps visualize a product’s positioning in the market. In our last blog, we reviewed the reasons to engage in value mapping, discussed questions and perspectives that get Product Management teams started and reviewed some best practices for creating and maintaining Value Maps. In this blog we look at the uses of Value Maps, exploring a number of specific applications. In the third blog in this series we will consider the limitations and pitfalls of value mapping.
Value Maps. A Value Map is a two dimensional graph that displays product prices on the y-axis and shows product weighted value scores on the x-axis. The best Value Maps are 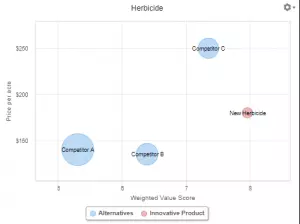 customer-centric, basing value scores on benefits instead of product features or performance. Product Management and Marketing teams often use benefit scores and benefit weights to derive value scores based on their own (more or less) objective assessment of what products deliver to customers. Alternatively, they use interviews or market research to construct Value Maps using benefit scores and weights based on customer surveys or interview feedback. Value Maps from either perspective can be useful. Comparing an internally generated Value Map with customer-generated Value Maps can provide additional insights into customer perceptions that might be subject to influence. A good Value Map plots a point for each product and uses bubble sizes to represent each product’s market size or market share.
Value Map Applications: A Case Study. There are a number of applications of Value Maps in Product Management and Marketing. In this blog we consider a case study, looking at a single, representative market as we explore six ways to apply Value Maps:
- Understand Product Positioning
- Monitor Market Changes.
- Identify Pricing Opportunities & Assess Competitor Responses
- Design High Impact Marketing Campaigns
- Identify Product Development & Innovation Opportunities
- As an Initial Step Toward Quantified/Dollarized Value Models and Value Propositions.
As we focus our discussion on a single case study market, we will explore each of these Value Map applications from the perspective of a different market competitor. Switching perspectives helps us to see competitors’ problems and opportunities from their own perspective as market players adjust to market changes.
To keep it simple, we will use the same Value Map framework across applications and across competitor perspectives. If all the competitors in a market were using value maps for their strategy in practice, their Value Maps would probably differ. The simplification that the Value Maps contain the same underlying evaluation criteria and data lets us look at the same content, without being distracted by differences, as we explore various strategies in a single market.
Let’s start by summarizing our market case study and the competitors we will consider.
Market Case Study: Lab Systems: Our market has five competing lab systems consisting of hardware and software, all of which are used to perform tests on biological samples. The five alternatives are:
- Dominant System X, initially with more than 40% market share, that provides reasonable accuracy with reasonable efficiency at a reasonable price.
- Low End System Y that provides the lowest cost solution, but is less accurate and more difficult to use
- Recent Entrant with comparable testing accuracy to Dominant System X but with a simpler user interface and streamlined workflow in comparison to the market leader
- Premium System Z, a system with greater accuracy than any of the first three systems but one that requires more time and greater lab expertise to deliver this higher level of testing accuracy.
- Component Based System W, an assortment of configurations of high end equipment and software, assembled on a bespoke basis to meet high scientific standards. Premium System Z was originally designed as an integrated system to take market share from bespoke configurations that we are classifying as Component Based System W.
With this market context, let’s consider the six applications of Value Maps.
Application #1: Understand Product Positioning (Perspective: Recent Entrant)
Whether or not we operate in a market with frequent innovation, Value Maps provide a useful snapshot of product positioning with underlying qualitative support for visual comparisons.
Building initial Value Maps as a Product Management discipline across products provides a common framework for assessing of an entire product portfolio without a large investment of time or money in performing in-depth market analyses.
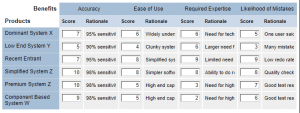
Case Study: Understand Product Positioning – From the Perspective of Recent Entrant. Recent Entrant gathers information on prices for the five systems. In an effort to move 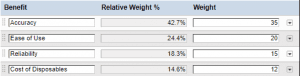 beyond an analysis of product features, the Recent Entrant team identifies four customer benefits as a good basis to understand how these competing lab systems compare: accuracy, ease of use, reliability and cost of disposables. They assign weights to the benefits with accuracy as the most important but with ease of use (their competitive edge) as second most important. Their weight for ease of use is preliminary as they have not yet fully understood the importance of this benefit in the marketplace.
 Then they engage in a detailed discussion of how each product scores in terms of each of the benefits, assigning a score from 1 to 10. They keep track of the rationale for their scores and gather information about the market size of each of their competitors.
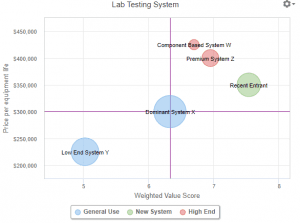
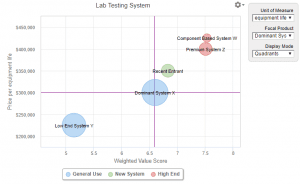 When they assemble the information, the Recent Entrant team looks at the resulting Value Map. A Value Map with quadrants centered on Dominant System X shows positioning consistent with their launch strategy. When they entered the market, the Recent Entrant team knew they were providing similar accuracy to Dominant System X with superior ease of use. When they launched, the system’s production was still in scale-up, so they deliberately set a higher price than Dominant System X. This price point was chosen in part to stay below competitors’ radar, but was also chosen to gauge the market’s interest in a simpler system. The team’s view at the time was that it is easier to cut prices than to raise them.
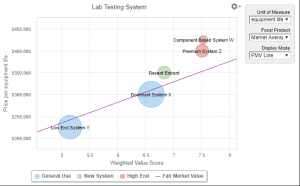 The Value Map, as compiled, with a Fair Market Value line drawn through the Market Average point suggests that their current pricing and positioning is unlikely to result in significant growth at the expense of competitors. Their visual price premium suggests that they see their advantage as incremental and are not positioning Recent Entrant to penetrate the market.
Compiling the Value Map provides an insight into positioning. In this case the insight may not result in a deliberate action but it does confirm a more intuitively derived strategy.
Application #2: Monitor Market Changes (Perspective: Dominant System X)
Once Value Maps have been created, requiring an additional process of updating Value Maps annually is usually low cost and low effort, providing a product management discipline with impact. Updating Value Maps becomes a way to reassess how positioning is changing in a market over time. Competitor pricing may have evolved, sometimes without our noticing. New products are introduced, but we may not have stopped to understand their differentiation and how they fit. Over time, our own competitive intelligence improves and our customers’ perceptions of competing products change. Value Maps provide a framework for commercial teams to understand how their competitive landscape is shifting and the moves they might consider to improve performance.
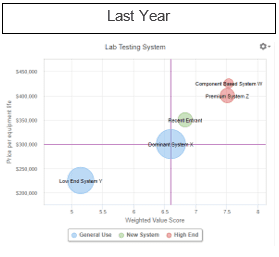
Case Study: Monitor Market Changes – From the Perspective of Dominant System X. One year passes. Starting with the same Value Map as the Recent Entrant team, the Dominant System X team might have cause to be complacent. But they have a lot at stake, so they consider how the Value Map has changed from last year to this year. The Dominant System X team has seen stagnant sales. There has been an economic downturn. There has been a continuation of the long term trend in user standards toward higher accuracy.
Without the Value Map, those changes might have just been noise. The Dominant System X team starts by gathering market sales data without adjusting scores and weights. The new version makes it apparent that Recent Entrant has doubled its sales and significantly increased market share. Why?
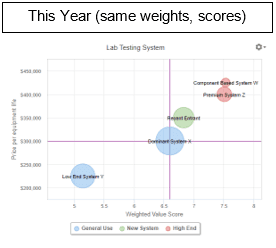 The System X team reconsiders the value scores in the previous Value Map. Recent Entrant could not have doubled its sales in a downturn without an under-recognized or under-appreciated advantage. The largest differentiator for Recent Entrant is their system’s ease of use. The previous Value Map must have underestimated the importance of ease of use. Perhaps it also underestimated the degree of differentiation between Dominant System X and Recent Entrant. The System X team takes a simple approach to revising the Value Map, doubling the weight on ease of use and raising the ease of use score for Recent Entrant from 7 to 9. The resulting picture makes more sense. Recent Entrant has become the most important high-value/ high-price alternative in the market. It appears that the higher end more accurate systems are less valuable, despite their accuracy from the
 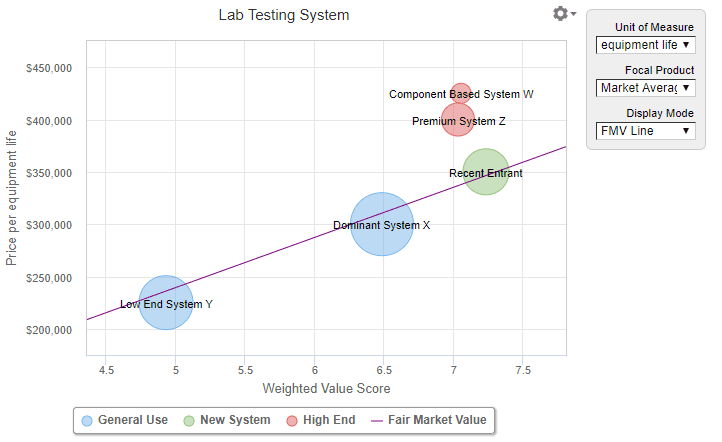 standpoint of most buyers. Perhaps it would make sense to segment the market so that niche buyers with the greatest need for system accuracy are viewed separately. Alternatively, the team could try to understand the tradeoffs buyers are making with further research.
The upshot is that the Dominant System X team now recognizes that they have a larger competitive threat than they had realized. They may not yet fully understand the value of better ease of use, but they appreciate that they now need to investigate further. This realization that Recent Entrant is a substantial competitive threat naturally gives the System X team pause as they consider their pricing strategy and their innovation strategy.
The benefit of updating Value Maps is that it heightens awareness of market developments. That awareness should result in faster strategic reactions and better-informed strategic initiatives.
Application #3: Identify Pricing Opportunities & Assess Competitor Responses (Perspective: Low End System Y)
A classic application of Value Maps is in pricing strategy and tactics. Value Maps are often used as price setting visualization tools both for B2B and B2C products. Although care is required, price-setting is one application of a Fair Market Value line in a Value Map, as a way to think of a “neutral” pricing strategy that is designed neither to penetrate a market nor to skim in a market. Broadly speaking, Value Maps help to identify whether there are pricing opportunities. Because they show the full array of competitors, they are also a natural framework for considering likely competitive responses to our pricing changes.
Case Study: Identify Pricing Opportunities & Assess Competitor Responses – From the Perspective of Low End System Y. The Low End System Y team has had a tougher year than other competitors, having experienced a 17% sales decline. Starting with the same revised Value Map as the Dominant System X team, the Low End System Y team considers their response. They are under shareholder pressure and don’t have funds available to invest in R & D. They take significant cost cutting measures. The only way they see potentially to increase sales is to cut price.
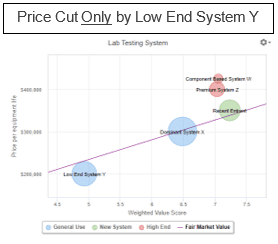 So the Low End System Y team considers an aggressive discounting program expected to result in a 20% average price decrease. If that is the only change in the market, the Value Map suggests that this will improve their competitive positioning, resulting in a more favorable price/value profile.
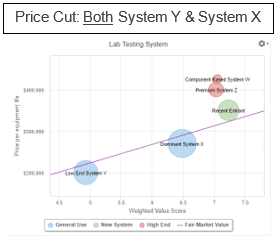 But the Low End System Y team realizes that they are a large enough player that an aggressive discounting program will be recognized quickly by the market leader. They also realize that Dominant System X has also been facing stagnant sales. In a market with just a few competitors, a response from Dominant System X is likely to be swift and substantial, especially given System X’s history in the market as a price leader. Even if Dominant System X only reacts with a 10% price cut, Low End System Y’s improved positioning will be quickly eroded as shown in the Value Map. The System Y team concludes that it is better to hold steady at their price point at the low end of the market.
Considering a price change in a Value Map is helpful in understanding the resulting change in positioning. By visualizing a price change in a broader competitive framework, Value Maps naturally pose the additional question of how competitors will respond. In pricing, as in chess, thinking several moves ahead, with competitive responses in mind, is essential.
Application #4: Design High Impact Marketing Campaigns (Perspective: Recent Entrant)
Seeing a shifting competitive landscape in a Value Map raises questions that help us better understand our customers and how they use our product. Every year, as a Value Map evolves, reconsidering the Value Map forces us to rethink more than our pricing, our benefit weights and our benefit scores. It drives us to think more clearly how our benefits impact customers directly in their business. The process of understanding benefits more deeply helps us design better marketing messages and helps us target more effectively.
Case Study: Design High Impact Marketing Campaigns – From the Perspective of Recent Entrant. Recent Entrant, one year after their initial Value Map, is in a good position. They have gained market share and they understand that this is primarily from their superior ease of use. So far none of their competitors have cut price on them in a significant way. But the Recent Entrant team naturally wants to understand why ease of use is so valuable. So they interview a few of their best customers.
From the interviews, the team learns that there are several ways that ease of use has an impact on their customers’ lab operations. First, with automated processes for performing lab tests built directly into their system, their larger lab customers are able to use lower cost lab techs to perform routine tests instead of scientifically trained personnel with advanced degrees. Second with the quality systems built into their software, their lab customers say that their lab personnel are making fewer mistakes. For lab operations with high quality assurance standards, fewer mistakes reduces the need to re-perform tests.
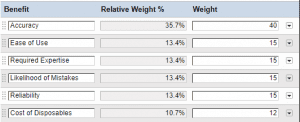 The Recent Entrant team rethinks the benefits in their Value Map, adding Required Expertise and Likelihood of Mistakes to the list of Benefits and changing the weights to reflect the importance of these benefits uncovered in their interviews.
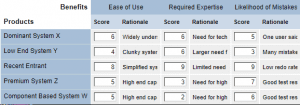 The team also reconsiders their scores and underlying rationale, focusing specifically on the three related benefits of ease of use, required expertise and likelihood of mistakes.
The resulting Value Map is not very different visually, but the reanalysis prompts the team to rethink their primary marketing messages and launch a marketing program with new campaigns and enhanced content. The team develops materials on how ease of use translates into the opportunity to reorganize lab operations, empowering lab techs to work efficiently. The team develops case studies of lab operation transformations, highlighting data on labor cost savings. They develop visual graphics of a comparison of redo rates at a major lab customer who switched to their system. Understanding the reasons for market evolution helps them understand their differentiation better, driving a better communication strategy. As a result of these communication initiatives, customer perceptions move toward the team’s own improved, objective understanding of their product’s potential impact on their customers.
Revisiting Value Maps regularly causes teams to dig deeper regarding their benefits and how their value is perceived. Over time, peeling the onion in terms of benefits improves customer understanding. Refined thinking about differentiation in turn improves communication strategy and execution.
Application #5: Identify Product Development & Innovation Opportunities (Perspective: Premium System Z)
Seeing a shift in the competitive landscape through a Value Map also helps to guide product development strategy. The same questions that help us understand our customers and how they use our products also help to identify priorities for innovation that are customer-centric instead of technology-centric. Understanding why a competitor is succeeding with customers generates hypotheses about how to improve our own differentiated product to be more aligned.
Case Study: Identify Product Development Opportunities – From the Perspective of Premium System Z. High scientific standards have always been the guiding principle for the Premium System Z team. But the harsh reality that they now recognize with their Value Map is that more accurate systems may have obvious attractions, but that there is a large market appetite identified by Recent Entrant for a product that deliver lowers accuracy more efficiently and with fewer mistakes.
 This raises a natural question for the Premium System Z team. If they could develop a new version of their more accurate system with greater ease of use, less need for scientific expertise and reduced likelihood of user error, would that provide a breakout opportunity that would move their system beyond increasingly niched positioning?
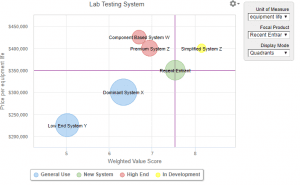 The team considers the product profile of a potential new product, “Simplified System Z,” with hardware that is the same as that of their current system, but with a more intuitive user interface and improved software to reduce testing mistakes. They use a Value Map to visualize the positioning of Simplified System Z and to consider the new system’s potential pricing.
The System Z team realizes that, even if they don’t cut price on the new system relative to the old system, their positioning would be much better. They don’t need to decide on launch pricing yet, as their development team pivots toward prioritizing simplification of their user interface and improved quality tools in their software. The System Z team will have time later to think about launch positioning, but the Value Map has helped to guide their innovation strategy.
Revisiting Value Maps regularly in a product development context helps to make development teams more customer-centric. Value Maps become a way to frame the positioning of new products and to prioritize innovation in gated development processes. This supports better decisions months and years in advance of product launch.
Application #6: As an Initial Step Toward Quantified/Dollarized Value Models and Value Propositions (Perspective: Recent Entrant)
Value Maps are useful, but for strategically important B2B products, the best commercial teams do not conclude their strategy work when they finish their Value Maps. Value Maps almost never permit a user to translate a value score into dollarized or euro-ized value. Value map scores can’t be added or subtracted from price to obtain a simple business case to buy. Value Map scores can’t be relied on to understand price setting in terms of value captured. Economic Value Estimation® is a great next step to set a better framework for pricing, segmentation and to form the basis for value conversations with customers. EVE® analysis and other methods of assessing value can be built on the foundation of what we have learned from Value Maps.
 Case Study: As an Initial Step Toward Quantified/Dollarized Value Models and Value Propositions – From the Perspective of Recent Entrant. Let’s start by realizing what the Recent Entrant team has already learned from the Value Map of the current market. The Value Map has helped orient the team toward the customer buying process by focusing on benefits instead of product features. The Value Map has highlighted the key differentiating positive benefits for Recent Entrant versus all other alternatives: ease of use, lower required expertise and lower likelihood of mistakes. Along the way, the Value Map has also helped us keep track of where Recent Entrant may have competitive disadvantages versus some alternatives in terms of accuracy, reliability or cost of disposables.
All of this is useful as the team starts its value model and its Value Proposition. In dollarizing value, it is always essential to think clearly about comparing the value of our product to that of a reference alternative. Eventually our Value Proposition can be structured to compare with a full array of competitors, but starting with a Next Best Competitive Alternative is a good way to move forward in analyzing economic value. In our market for lab systems, it is natural to identify the Next Best Alternative for Recent Entrant as Dominant System X. It is the largest competitor and it is also the closest to New Entrant in terms of its benefits and its positioning.
The Recent Entrant team has already gathered price data for competitors and has already thought about units as they considered prices for their Value Map. In comparing Recent Entrant to Dominant System X, the differentiating Benefits are also clear from the Value Map. With no difference, in accuracy, reliability or cost of disposables, the New Entrant team can focus their analysis of value on ease of use, lower required expertise and lower likelihood of mistakes.
The logic for a value driver based on lower required expertise is straightforward for the team. How do users of Dominant System X staff their lab operations for testing versus what is possible with Recent Entrant? What are the costs of different types of lab personnel? Having identified these parameters, quantifying a Personnel Cost value driver can either be simple math that gets us to a good approximation or complicated math that permits a detailed discussion with a customer of how they would change their facility’s staffing plans with the purchase of Recent Entrant systems.
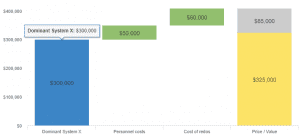 The framework for a value driver based on reduced likelihood of mistakes should also be clear. What is the likelihood of mistakes for both systems? Once the team makes some basic assumptions about lab operations, it is straightforward to derive the savings in operating costs from having to perform fewer test redos. With these two value drivers, we already have a strong Value Proposition that shows the business case to buy at Recent Entrant’s current price.
Identifying further quantifiable value drivers based on ease of use may seem to be more difficult since “ease of use” seems like a more intangible benefit. But in this situation, discussion and investigation may reveal further differentiators that turn into value drivers. For example, ease of use may mean that more lab personnel can use the system when they need it, resulting in a reduction in testing delays. Faster time to results is often valuable, with its dollarized benefits readily quantifiable in many lab settings.
With some good messaging there is then a Value Proposition that is effective in a head-to-head comparison with Dominant System X, but is also be a starting point for comparisons with other alternatives where there are other differentiators. For example, Recent Entrant also outperforms Low End System Y in terms of accuracy. Dollarizing the benefits of accuracy will help to defend a larger price premium for Recent Entrant versus Low End System Y.
Having a Value Map is a great first step towards a strong Value Proposition. It jump starts good value modeling and provides perspective on differentiation versus the various competitors that commercial teams usually face in the marketplace.
Why Value Maps? In summary, implementing a product management discipline requiring Value Maps helps to drive a common customer-centric framework for product strategy that can be applied in many useful ways. Value Maps help to understand and monitor positioning, evaluate potential price changes and consider marketing and innovation strategy on a customer-centric basis. We can go deeper than Value Maps in understanding customer value, but they are a great place to start.