The first in a series of articles with practical advice for quantifying intangible customer value.
“How do you quantify intangible value?” is a question we get asked a lot. Although I enjoy answering that question, I instinctively dislike how it’s framed because it implies that value is divided into two categories: hard, scientific fact versus fuzzy, made-up stuff. And further, that any intangible value is strongly suspected to be in the second category unless proven otherwise. This hardcore quant bias I refer to as the “scientific” mindset.
Likewise, accountants have a strict, no-nonsense view of intangible value. Accountants define an “intangible asset” as anything that has no physical presence. This is used to describe things like brand, goodwill and trademarks. Accounting rules dictate that the value of an intangible asset is quantified only when it is sold, not created. Therefore, nobody truly knows the value of the Apple brand until the day another company buys the rights to use it.
Think Value Like a Customer
So, when I’m asked that “how-to” question, my first response is: DON’T think like a scientist or an accountant! Neither perspective helps a product manager make profitable strategy decisions, nor helps a marketing manager create meaningful messaging, nor moves a prospective customer toward a purchase decision.
 Who should you think like? Your customer, of course!
Value isn’t binary to them. Customers perceive value as a continuum that stretches from the plainly obvious, to less obvious yet understandable reasons, and perhaps extending out to subtle gut feelings. At one end is the most obvious form of customer value: the discount or rebate. Charge your customer less than what they usually spend and they’ll immediately recognize the difference as “value” – more money in the customer’s pocket after the transaction. It doesn’t get more obvious than that! Which is why discounting often ends up being the pricing tactic of last resort.
True fans of value frown upon habitual price discounting and instead focus on lower cost of ownership. In other words, not more money in the customer’s pocket at the time of purchase, but instead later down the road with other expenditures. An easy example is “reduced energy costs” as in “buy our solution and you’ll see your heating bills decrease X% in the first year.” Even scientists and accountants can agree that’s a legitimate, tangible value claim because it could be easily validated by tabulating and comparing past versus future energy bills.
Fair enough. But how to address the original question of quantifying intangible value? After all, no company has ever gotten an invoice for “goodwill” or “brand reputation.” Is this where quantifiable value comes to a dead end? No way! I’ll go even further and claim that nearly every product differentiator can be quantified IF you take the time and effort to measure it. Of course, that doesn’t mean that it is always worth measuring, but it is possible. Any responsible product manager should at least give it an hour or two of thoughtful effort.
A Practical Example of “Intangible Value”
This is a first of a series of blog articles to provide practical examples of so-called intangible value drivers that have been successfully quantified by companies we’ve worked with. Full disclosure: these examples have been made generic to protect our customers’ confidentiality. The hope is that anybody reading this can adapt this example to their own business and use it for better strategic decision making, messaging or more productive  customer discussions.
Today’s example: downtime.
All businesses realize that disruptions cost money. The particular terminology varies by industry. For example, “downtime” is commonly used in manufacturing to describe a stopped assembly line. NPT (non-productive time) is a term used in the oil and gas industry to describe a non-functioning well. Other types of businesses may refer to this as “lost productivity,” say for example, an IT network failure for a services business.
Sometimes disruptions are anticipated, such as the case with scheduled maintenance for machinery or vehicles. In practice, we usually like to focus more attention on unscheduled downtime because this is where you can uncover a lot of potential customer value. Here you have two basic quantification approaches – cost impact versus revenue impact.
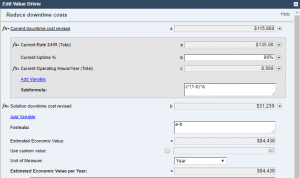
The Cost Impact of Downtime
This approach requires adding up all the costs incurred during the downtime period. First on the list is the direct cost (e.g. unscheduled repairs) to put things back in order. Next is to calculate the cost of the lost productivity. The logic is that the business is still spending money for resources even when the production line grinds to a halt. This typically includes the fully-loaded cost of the associated labor force – regardless if they are just waiting around for work to start again. Recently, observers used a similar method to calculate the loss of productivity caused by the 2017 solar eclipse in the US. See: The Solar Eclipse Cost the US Economy a Huge Amount of Money.
Aside from the repair and direct labor costs, other fixed operating costs should also be included. In this bucket are resources like utilities (e.g., lights, heating/air conditioning) and rent that still need to be paid for during the disruption period. There can even be additional costs associated with dealing with the aftermath of the disruption including expedited delivery costs, late penalties, overtime, etc.
Factoring all this in, an estimated cost of downtime – often stated per hour – can be a sobering number indeed. In many cases the customer may only have a rough idea of what downtime is costing them, but by breaking it down and quantifying it, you suddenly make the intangible very real, especially if the customer suffers from more than a few hours of lost productivity over the course of a year. It doesn’t matter whether your initial assumptions about labor rates and other costs are inaccurate. A good reasonable estimate based on input from marketing and sales teams is enough to be used in preliminary customer tests. You just want something to get the customer to react to – “that’s too high or that’s too low!” It’s more important to validate the logic. Just getting customer agreement on the soundness of the logic behind the quantification is a huge value selling win.
Please note: the one assumption where you DO need to have credible proof is your offer’s differentiation. If you claim to cut a customer’s downtime in half be prepared to back that claim up with evidence from case studies or customer testimonials.
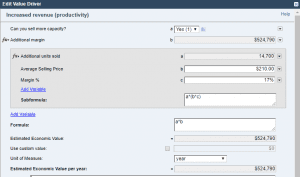
The Revenue Impact of Downtime
An alternate approach to quantifying downtime is to estimate the amount of lost revenue during the downtime period. The key assumption here is that the lost sales cannot be made up. The math here is very straightforward: the amount of lost sales (number of units) times the average selling price. Then multiple that by the percent margin. Note that even though this is called a revenue value driver, it is more justifiable to quantify it on a margin basis, though it is not that unusual to show it entirely at top-line revenue gain. Ultimately it is the audience (i.e., customer) who decides what is appropriate. Likewise, in deciding what type of margin to use: gross, operating, contribution etc. Operating margins are usually easiest to look up by industry or by specific company (especially publicly-traded companies). Again, you only need reasonable assumptions to develop a straw-man case to begin the conversation.
Just like with the cost approach, it is essential to have solid proof-points about your differentiation.
Should you do both?
For most situations it’s a question of choosing one method (cost versus revenue) to avoid double-counting. One factor to consider when deciding is who the potential audience is and whether their personal KPI’s (key performance indicators) are more cost versus revenue-oriented. For example, brand owners, marketers, and sales stakeholders find revenue value drivers more relevant. Operations-minded stakeholders likewise gravitate toward cost value drivers.
Flip it Positive: Productivity Gains
Another variation of the reduce downtime value driver is its polar opposite: increase efficiency. Rather than framing downtime as a loss to be minimized, you frame it as an opportunity to increase output without any additional investment in capacity. In labor-intensive or services industries, you can more easily justify quantifying the gain on a full revenue (not margin) basis, since the incremental cost of each unit is small. As you can imagine, this can create an impressive amount of customer value.