The forces of globalization and technology have made the marketplace for all goods and services much more competitive. Competing primarily on low price/low cost, even if you have the capability to do so is not a sustainable business strategy. Instead, according to the experts (such as Dr. Thomas Nagle, author of Emerging from the Great Recession: 8 Keys to Driving Profits, Growth, and Customer Value), competing on value is really the only viable strategic option. When you build a value model for your product, you open the door for opportunities to strengthen your product offer definition, uncover lucrative customer segments, tighten your communication messages, and of course set a more profitable price point.
Many a successful B2B product has profited handsomely from this approach. Internal and external strategic pricing consultants have relied upon it faithfully for years. And more recently, sales professional are deploying more and more value selling techniques and tools.
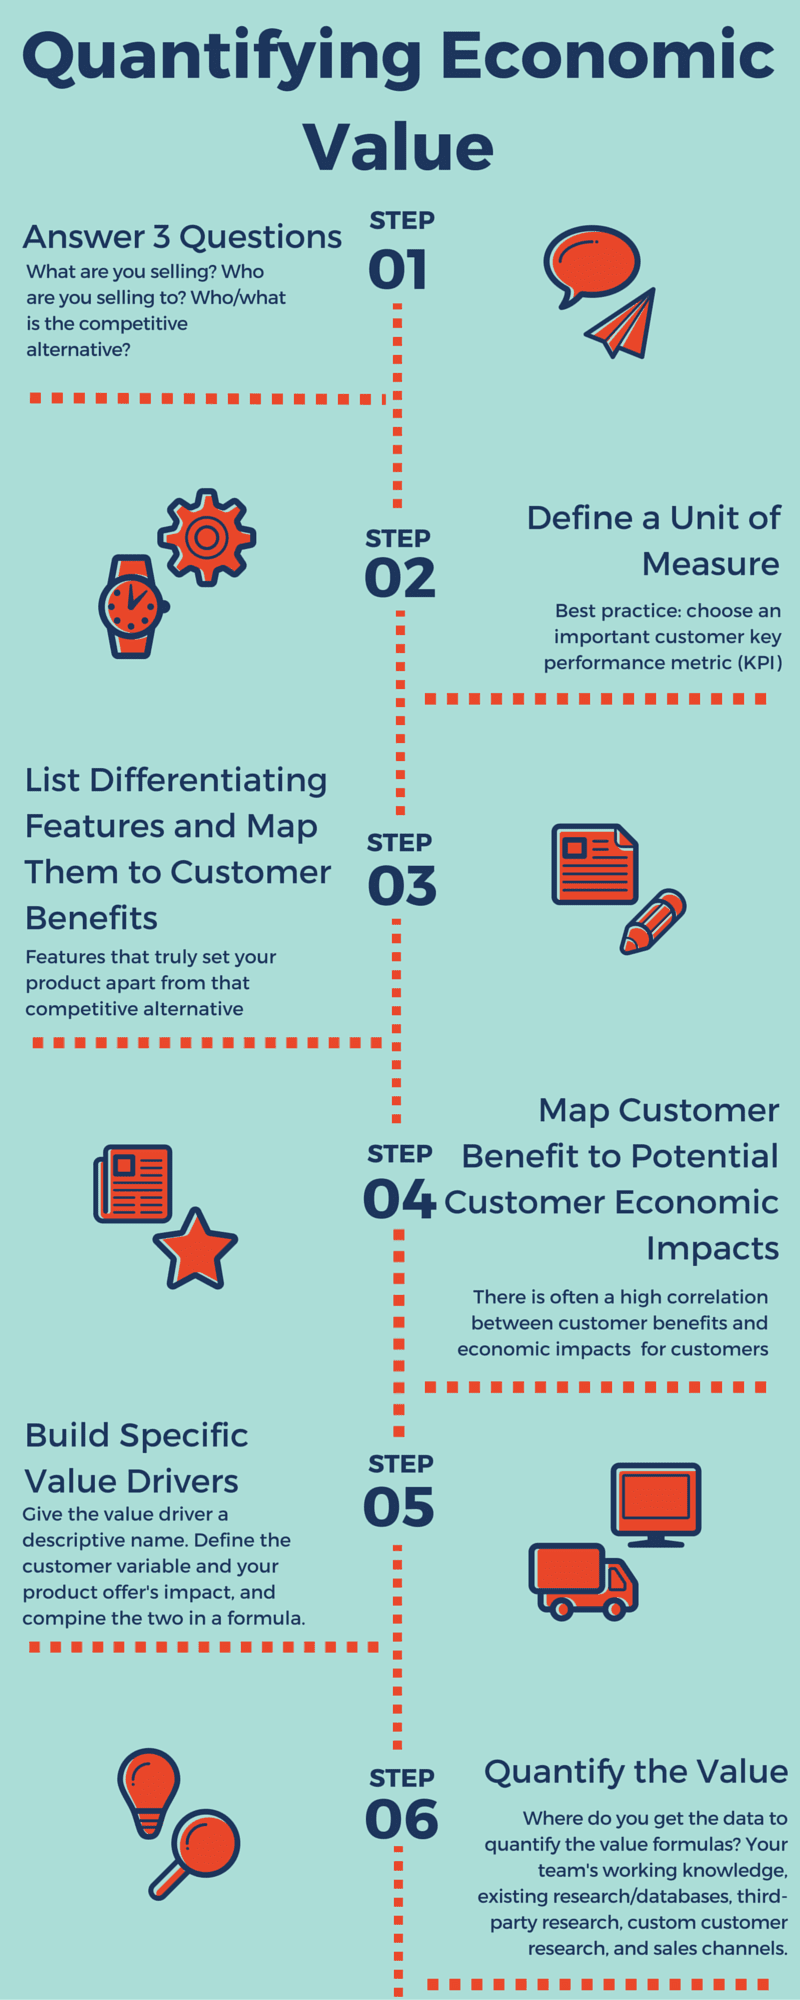
This guide is written for the benefit of the average business person (i.e., non-pricing expert) and describes the steps for quantifying customer economic value. It is based upon several years of experience advising hundreds of product, marketing and sales teams. The six steps for building a value model are:
These steps can be done with just a few hours of effort, using just the existing data at hand. For a typical product manager within a larger global B2B enterprise, this modest time investment can find millions of dollars of “money left on the table.”